Game Development Costs Are Rising 8% Per Year
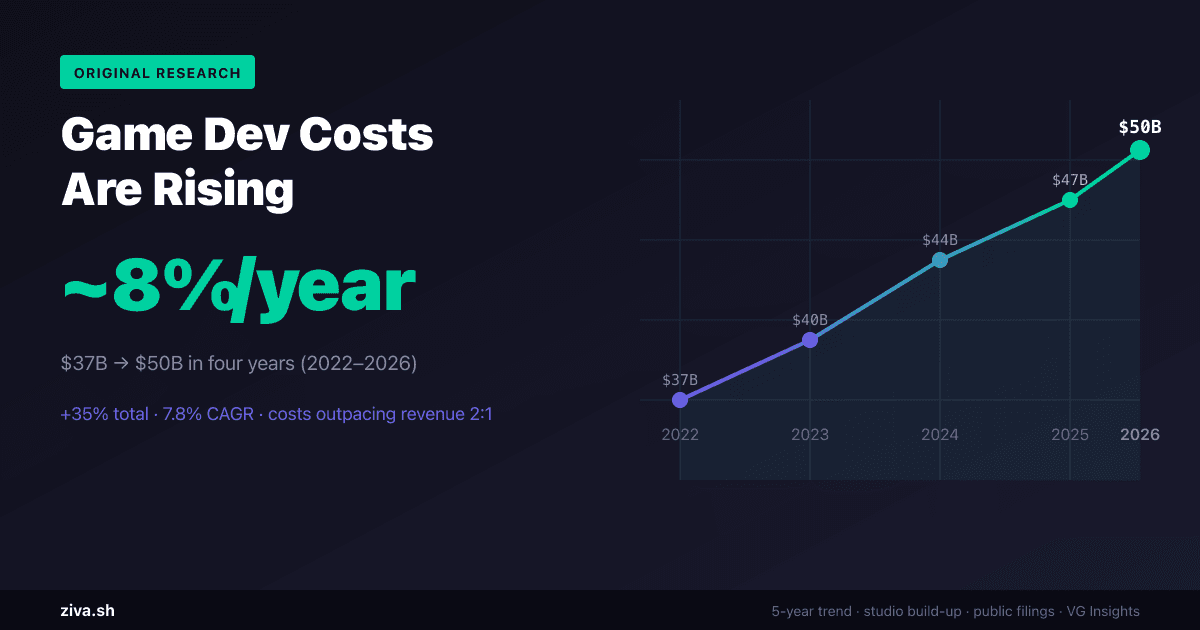
Global game development spending grew from ~$37B in 2022 to ~$50B in 2026 — a 35% increase, or ~7.8% CAGR.
The biggest drivers: AAA team sizes growing 36%, salary inflation compounding at 5%/yr, and the emergence of “Triple-i” as a distinct spending tier.
We applied the same
studio-level build-up methodology
from our 2026 estimate and worked backwards using historical data.
Building on our $50B estimate
In our previous analysis, How Much Does It Cost to Make a Video Game in 2026?, we estimated global game development spending at ~$50B/year using three independent methods: public company filings, workforce math, and studio-level build-up. All three converged on the same range.
That analysis was a snapshot. It answered “how much does the industry spend today?” but not “how fast is that number growing?” This post applies the same studio-level build-up methodology backwards through 2022–2026 to show the trend.
$37B → $50B in four years
| Year | Total Dev Spend | YoY Growth | Key event |
|---|---|---|---|
| 2022 | ~$37B | — | Post-COVID hiring surge begins |
| 2023 | ~$40B | +8.1% | Studio expansions peak; salaries spike |
| 2024 | ~$44B | +10.0% | AAA budgets pass $100M avg; layoffs begin at top |
| 2025 | ~$47B | +6.8% | Layoffs reduce headcount but not total spend (severance, longer cycles) |
| 2026 | ~$50B | +6.4% | Spend concentrates in fewer, larger projects |
The compound annual growth rate (CAGR) from 2022 to 2026 is ~7.8%. This outpaces general inflation (~4% over the same period) by nearly 2x, meaning real game development costs are rising, not just nominal ones.
Where the money went
| Tier | 2022 | 2026 | Growth | What changed |
|---|---|---|---|---|
| AAA | $14B | $20B | +43% | Teams grew from ~220 to ~300 avg. Dev cycles lengthened from 4 to 6+ years. |
| AA | $5.5B | $7.5B | +36% | More studios in the 50–100 person range. Live-service costs added. |
| Mid-tier (Triple-i) | $6.5B | $9B | +38% | This tier barely existed as a category in 2022. Studios like Larian, Coffee Stain, and Warhorse grew into it. |
| Small indie + Solo | $3.5B | $3B | -14% | Paradox: more indie devs, but revenue concentration means fewer can sustain full-time work. Solo spending declined as hobbyists replaced professionals. |
| Mobile | $7.5B | $10.5B | +40% | Hypercasual declined but mid-core mobile (Hoyoverse, Supercell expansions) absorbed the spend. |
How we estimated backwards
We used the same studio-level build-up from our 2026 analysis and adjusted each input variable backwards using available historical data:
Studio counts by year were estimated using:
- VG Insights’ Steam developer data : Steam went from ~30K developers in 2022 to ~44K in 2024. Professional studio count grew more slowly (~24K→30K) as most new entrants were hobbyists.
- Statista Steam release data : annual releases grew from ~10K (2021) to ~14K (2023), indicating more active studios.
Average team sizes were adjusted using:
- Bain & Company’s gaming report : documents AAA team size inflation from “a few hundred” to 300+ average.
- StudioKrew’s budget analysis : tracks AA team sizes at 50–100, up from 30–60 in 2020.
- Public disclosures: Rockstar had ~2,000 on GTA VI vs ~1,000 on GTA V. CD Projekt had ~600 on Cyberpunk Phantom Liberty vs ~500 on base game.
Loaded labor costs were adjusted using:
- IGDA Developer Satisfaction Survey : salary data across multiple years shows ~5% annual growth in game dev compensation.
- ESA employment data : US game industry average compensation rose from ~$95K (2022) to ~$115K (2026) fully loaded.
- Bureau of Labor Statistics CPI data for general inflation baseline.
Why costs rose 35% while revenue grew 20%
Game industry revenue grew from ~$160B (2022) to ~$190B (2026), roughly 19%. Development costs grew nearly double that rate. The gap is explained by five structural shifts:
1. AAA team bloat. The average AAA game now requires 300+ developers, up from ~220 in 2022. Games-as-a-service titles require permanent live teams on top of the core dev team. A single AAA project now carries $100M+ in annual labor before marketing.
2. Salary inflation. Game developer salaries compounded at ~5% per year from 2022 to 2026, driven by competition from tech companies and the post-COVID remote work premium. Senior engineers and technical artists saw the steepest increases (~8%/yr).
3. Mobile studio proliferation. The number of professional mobile game studios grew from ~3,500 to ~5,000 as mid-core mobile (gacha, strategy RPGs) replaced the declining hypercasual segment. These studios spend more per title than hypercasual studios did.
4. Longer development cycles. AAA dev cycles stretched from 3–4 years to 5–7 years. More years in development means more years of burn. GTA VI has been in development since ~2019. Elder Scrolls VI was announced in 2018 and may ship in 2027+.
5. The “Triple-i” tier emerged. Studios like Larian (Baldur’s Gate 3, ~400 people), Coffee Stain, and Warhorse grew from indie-sized to mid-tier budgets. Bain’s research now categorizes these as “Triple-i” — teams of 50+ with budgets of $20M–$50M that didn’t exist as a category five years ago.
The squeeze
Development costs growing faster than revenue means margins are compressing. This explains the wave of layoffs in 2023–2024: studios tried to bend the cost curve back toward revenue growth. It partially worked — 2024 and 2025 growth rates slowed to ~6.5% from ~10% in 2023 — but the structural drivers (team size, cycle length, salary expectations) haven’t reversed.
For context:
- Revenue CAGR (2022–2026): ~4.4%
- Dev cost CAGR (2022–2026): ~7.8%
- Gap: ~3.4 percentage points per year of margin erosion
This is why AI-assisted development tools are not a nice-to-have — they’re the only plausible path to bending the cost curve without further layoffs or quality cuts. A 20% productivity gain on a $50B cost base is $10B in value.
Full build-up by year
| Tier | 2022 | 2023 | 2024 | 2025 | 2026 | 4yr CAGR |
|---|---|---|---|---|---|---|
| AAA (~200 studios) | $14B | $16B | $18B | $19B | $20B | 9.3% |
| AA (~800→1,000 studios) | $5.5B | $6B | $6.5B | $7B | $7.5B | 8.1% |
| Mid-tier (~2K→3K studios) | $6.5B | $7B | $7.5B | $8B | $9B | 8.5% |
| Small indie + Solo (~20K) | $3.5B | $3.8B | $4B | $4.2B | $3B | -3.8% |
| Mobile (~3.5K→5K studios) | $7.5B | $7.2B | $8B | $8.8B | $10.5B | 8.8% |
| Total | $37B | $40B | $44B | $47B | $50B | 7.8% |
Sources: VG Insights via Game Developer , Bain & Company , ESA , StudioKrew , IGDA DSS , public company 10-Ks. Full methodology detailed in our original $50B estimate.